University Benchmarks

Ranking the Top 100 Academic Universities

UniversityBenchmarks.com ranks the universities that attract and produce the best academic students.

There are many 'University Rankings' on the internet. Most rankings rely heavily on subjective metrics like 'reputation' and 'selectivity'. UniversityBenchmarks is purely an academic ranking model. The rankings are based on the reported academic and financial metrics of the colleges. There are no subjective factors like 'reputation' that are used. The calculations are performed using normal statistical models. All universities are considered equal and there is no weighting of the ranking categories.

The university 2014-2015 dataset is comprised of over 2400 US Universities & Colleges and comes from multiple sources using the most favorable reported metrics for a university.

The universities are ranked against each other in each filtered set. It is an iterative process whereby lower ranking universities are removed and the set is re-ranked until the final set of 100 is reached.

Selecting 'Rank Top 10 Only' will show the Top 10 for each filter category ranked against each other.

The academic rankings of the universities within the major conferences (ACC, Big12, Big10, Pac12, SEC) are available.

The 2017 rankings will be available in August.

Notes:
  • It is possible for universities to be ranked higher/lower than one another depending on the filter set.
  • Conference averages are based on the top 8 schools in the conference.
  • Public Schools are highlighted
  • Clicking on the university's seal icon will take you to the university's website.

Ranking Fields

Rank - Overall rank based on the average of the ranking fields (Scores, Difficulty, Smartest, Brainpower, Faculty and Research).

Scores - SAT & ACT scores. The university's test scores are corrected for dropout rate when score level is Good, Excellent or Elite. This will slightly boost scores for highly competitive schools.

Difficulty - Academic rigor is estimated based on how difficult it is to get an "A" at the university. An estimated GPA at the university is calculated for the average US Student. University grade inflation, average GPA, and STEM density are factors.

Smartest - University that can field the highest scoring students based on the average US University size. Higher Smartest Rank = "Smartest for the Average University"

Brainpower - The average "smartest" rank using 5 reference populations (CalTech, MIT, Stanford, GaTech and Berkeley). Higher Brainpower Rank = "Higher Density of Smart Students". The university ranked higher can mathematically field 'X' number of smarter students than universities ranked below them.

Faculty - Ranking based on number of % of faculty with awards and academy membership.

Research - Ranking is achieved by iteratively ranking the average of 3 research metrics (r-pop, r-stem, r-other ). The lowest ranked college is then removed and the new set is re-ranked. The result is the schools with potentially the strongest research environments per student bubble up to the top regardless of size or research budget.

  • r-pop - Average research spending for student population
  • r-stem - STEM research spending
  • r-other - Other/Medical/Health research spending

Salary ROI - "Salary Return on Investment" is not used in the overall ranking but is provided for additional information. Using the undergraduate average starting and mid-career salaries, the rank is based on a 20yr salary accumulation (with raises) minus the cost of a 4 year education at the university. Salaries are normalized across the country using the average COLA for the university's geo-economic region (7 regions total). The COLA effect is diminished by the level of the university. Elite, Excellent and Good universities have a greater distribution of graduates across the country and a diminishing COLA effect. The resultant value would be the graduate's spending potential over the 20yr period.

Overall ROI - "Overall Return on Investment" is not used in the overall ranking but is provided for additional information. The average of Overall Rank and Salary ROI. This would be the "Best academic bang for the buck". Colleges that produce the best education, at the best price, with the best return will be ranked higher.

Color Key - ranks are colorized as follows 1 2 3 4 5 6 7 8 9 10 50 100

The 2016 University Academic Rankings

Centennial Conference (Average)

2016 University Academic Rankings

This article includes a list of references, related reading or external links, but its sources remain unclear because it lacks inline citations. Please improve this article by introducing more precise citations. (March 2013) (Learn how and when to remove this template message)

Eleven highly selective private colleges compose the Centennial Conference. The institutions are renowned nationally for their traditions in higher education excellence, each with impressive academic histories. Ten of the eleven members of the Centennial Conference rank among the top 100 national liberal arts colleges (with Johns Hopkins University being the only research intensive university in the conference), and six of the members are within the top 50.

On the average, Centennial members boast of 19 varsity teams per campus which is well above the national norm. Conference members have won eleven NCAA team titles: Johns Hopkins women's cross country (2012, 2013, 2014), Gettysburg women's lacrosse (2011), Haverford men's cross country (2010), Franklin & Marshall women's lacrosse (2007, 2009), Ursinus field hockey (2006), Washington men's lacrosse (1998), and Washington men's tennis (1994, 1997).

History

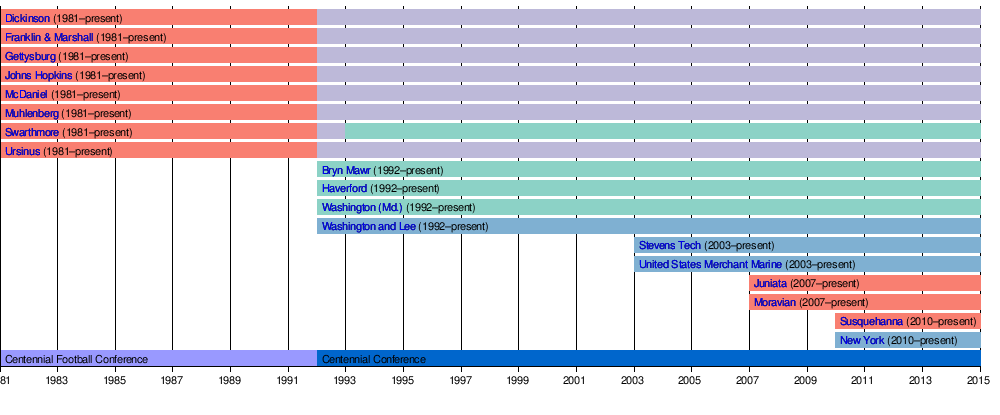
According to the Centennial Conference's web site: "On June 4, 1981, Keith Spalding, then-president of Franklin & Marshall College, made the announcement that "eight private colleges found it timely and appropriate to form a round-robin football schedule among institutions with similar attitudes and practices in intercollegiate football competition." With that statement, the Centennial Conference was born. Those private colleges were Dickinson College, Franklin & Marshall College, Gettysburg College, Johns Hopkins University, Muhlenberg College, Swarthmore College, Ursinus College, and Western Maryland College (later renamed and now known as McDaniel College).

The conference moved from a football-only conference to an all-sports conference after a 1991 feasibility study. The study also recommended to expand from eight schools to eleven. The other schools recommended were Bryn Mawr College, Haverford College, and Washington College. Those three schools accepted and became charter members in 1992 as the conference expanded its sports offerings.

All of the charter members defected from the Middle Atlantic Conference, MAC. Johns Hopkins and McDaniel College both played in the Mason-Dixon Conference prior to entering the MAC in 1975.

Member schools | Current members

- Johns Hopkins was on multiple all-sports conference affiliation membership for some sports in the University Athletic Association until the end of the 2000-01 season.

Affiliate members | Membership timeline | Sports

Teams compete in men's and women's cross country, field hockey, football, men's and women's soccer, women's volleyball, men's and women's basketball, men's and women's swimming, men's and women's track and field, wrestling, baseball, men's and women's golf, men's and women's lacrosse, softball and men's and women's tennis.

References | External links

Text is available under the Creative Commons Attribution-ShareAlike License; additional terms may apply. By using this site, you agree to the Terms of Use and Privacy Policy. Wikipedia® is a registered trademark of the Wikimedia Foundation, Inc., a non-profit organization.

... [more on wikipedia]

This article uses material from the Wikipedia article "Centennial Conference (Average)", which is released under the Creative Commons Attribution-Share-Alike License 3.0

Centennial Conference Details

Centennial Conference Details
detail value
state-
conferenceCentennial Conference
public-Conf-
scores1982/1321/30
levelExcellent
rank[-
overall ROI rank[170
sizesmall
undergrads2416
grads1927
price61579
drop12
stem22
research261
scores validTrue
Common Questions...

What are the academic rankings for Centennial Conference (Average)?

1. number - for Academics.

2. number 170 for ROI (Return on Investment).

What universities are similar to Centennial Conference (Average)?

1. Lewis & Clark College

2. Gettysburg College

3. Union College

4. Macalester College

5. Colorado College

6. Occidental College

7. Rhodes College


National Academic Rankings

(summary of all ranking placements)

Centennial Conference National Academic Rankings

Centennial Conference National Academic Rankings
category rank scores difficulty smartest brainpower faculty research salary ROI overall ROI
Top250-687119617115323219170
Conferences19101345324478048
Top Ten Top250-687119617115323219170


Peer Universities / Similar Universities

(mathematically similar student body, size, academics, stem, salary... etc)

Centennial Conference Peer Universities, Similar Universities to Centennial Conference

Centennial Conference Peer Universities, Similar Universities to Centennial Conference
match image university state conference public level rank overall ROI
92.68
Lewis & Clark CollegeOregonNorthwest ConferencePrivateExcellent179221
86.58
Gettysburg CollegePennsylvaniaCentennial ConferencePrivateExcellent170148
86.19
Union CollegeKentuckyMid - South Conference / Appal...PrivateBelowAverage162178
85.72
Macalester CollegeMinnesotaMinnesota Intercollegiate Ath ConfPrivateExcellent133146
85.66
Colorado CollegeColoradoSouthern Collegiate Athletic C...PrivateExcellent149160
85.63
Occidental CollegeCaliforniaSouthern California Intercoll ...PrivateExcellent158162
85.60
Rhodes CollegeTennesseeSouthern Athletic AssociationPrivateExcellent191147
85.60
Colgate UniversityNew YorkPatriot LeaguePrivateExcellent9283
85.31
St Olaf CollegeMinnesotaMinnesota Intercollegiate Ath ConfPrivateExcellent144127
85.10
Colby CollegeMaineNew England Small College Ath ConfPrivateExcellent132155
84.78
Grinnell CollegeIowaMidwest ConferencePrivateExcellent114123
84.52
Bucknell UniversityPennsylvaniaPatriot LeaguePrivateExcellent13193
84.32
Brandeis UniversityMassachusettsUniversity Athletic AssociationPrivateExcellent46116
83.76
Dartmouth CollegeNew HampshireIvy LeaguePrivateElite1921
82.99
Princeton UniversityNew JerseyIvy LeaguePrivateElite411
82.56
College of William and MaryVirginiaColonial Athletic AssociationPublicExcellent5460
82.46
Brown UniversityRhode IslandIvy LeaguePrivateElite2534
79.74
Wellesley CollegeMassachusettsNew England Women's & Men's At...PrivateElite78158
79.64
University of Puget SoundWashingtonNorthwest ConferencePrivateGood227223
79.62
Denison UniversityOhioNorth Coast Athletic ConferencePrivateGood204170
79.52
Trinity UniversityTexasSouthern Collegiate Athletic C...PrivateGood212170
79.26
Union UniversityTennesseeGulf South ConferencePrivateGood225213
79.07
Furman UniversitySouth CarolinaSouthern ConferencePrivateGood232192
79.06
Yeshiva UniversityNew YorkSkyline ConferencePrivateGood141208
79.05
Williams CollegeMassachusettsNew England Small College Ath ConfPrivateElite58161
78.99
The College of WoosterOhioNorth Coast Athletic ConferencePrivateGood277317
78.83
Wesleyan UniversityConnecticutNew England Small College Ath ConfPrivateElite73137
78.59
Hamilton CollegeNew YorkNew England Small College Ath ConfPrivateElite115153
78.55
Washington and Lee UniversityVirginiaOld Dominion Athletic ConferencePrivateElite11746
78.31
Bowdoin CollegeMaineNew England Small College Ath ConfPrivateElite64162
77.99
St Mary's College of MarylandMarylandCapital Athletic ConferencePublicGood275409
77.97
University of TulsaOklahomaAmerican Athletic ConferencePrivateGood13975
77.89
Pomona CollegeCaliforniaSouthern California Intercoll ...PrivateElite52125
77.47
Whitman CollegeWashingtonNorthwest ConferencePrivateExcellent153154
77.12
Reed CollegeOregonNo Conference AffiliationPrivateExcellent106144
76.94
Bryn Mawr CollegePennsylvaniaCentennial ConferencePrivateExcellent137205
76.27
Yale UniversityConnecticutIvy LeaguePrivateElite337
76.27
Santa Clara UniversityCaliforniaWest Coast ConferencePrivateExcellent12398
76.24
SUNY College at GeneseoNew YorkState University of New York A...PublicExcellent111184
76.14
University of San DiegoCaliforniaPioneer Football League / West...PrivateGood203195
75.87
Johns Hopkins UniversityMarylandCentennial ConferencePrivateElite1647
75.85
Southern Methodist UniversityTexasAmerican Athletic ConferencePrivateExcellent8073
75.68
Vanderbilt UniversityTennesseeSoutheastern ConferencePrivateElite148
75.60
Villanova UniversityPennsylvaniaColonial Athletic Association ...PrivateExcellent9968
75.51
Washington University in St LouisMissouriUniversity Athletic AssociationPrivateElite86
75.39
Emory UniversityGeorgiaUniversity Athletic AssociationPrivateExcellent3629
74.77
University of MiamiFloridaAtlantic Coast ConferencePrivateExcellent4493
74.53
SUNY at BinghamtonNew YorkAmerica EastPublicExcellent65125
74.50
Baylor UniversityTexasBig Twelve ConferencePrivateGood134128
74.35
Miami University-OxfordOhioMid American ConferencePublicGood11867


Academic Peer Universities / Similar Academics

(mathematically similar academics)

Centennial Conference Academic Peer Universities, Similar Academic Universities to Centennial Conference

Centennial Conference Academic Peer Universities, Similar Academic Universities to Centennial Conference
match image university state conference public level rank overall ROI
97.33
New England Women's & Men's Athletic Conference (Average)-New England Women's & Men's At...-Conf-Excellent-60
96.21
Villanova UniversityPennsylvaniaColonial Athletic Association ...PrivateExcellent9968
95.81
Stevens Institute of TechnologyNew JerseyEmpire EightPrivateExcellent9943
95.70
Upstate Collegiate Athletic Association (Average)-Upstate Collegiate Athletic As...-Conf-Excellent-130
95.00
Southern California Intercoll Ath Conf (Average)-Southern California Intercoll ...-Conf-Excellent-130
94.83
New England Small College Ath Conf (Low)-New England Small College Ath Conf-Conf-Excellent-165
94.82
Haverford CollegePennsylvaniaCentennial ConferencePrivateElite97182
92.95
Fordham UniversityNew YorkPatriot League / Atlantic 10 C...PrivateGood109167
92.34
Claremont McKenna CollegeCaliforniaSouthern California Intercoll ...PrivateElite95118
91.86
Atlantic 10 Conference (Average)-Atlantic 10 Conference-Conf-Good-158
90.37
New England Small College Ath Conf (Average)-New England Small College Ath Conf-Conf-Elite-144
88.60
California Polytechnic State University-San Luis ObispoCaliforniaBig Sky Conference / Big West ...PublicGood9688
87.20
Clemson UniversitySouth CarolinaAtlantic Coast ConferencePublicAboveAverage9851
84.99
University of DelawareDelawareColonial Athletic AssociationPublicAboveAverage107138
84.66
Indiana University-BloomingtonIndianaBig Ten ConferencePublicAboveAverage10292
83.57
University of South Carolina-ColumbiaSouth CarolinaSoutheastern ConferencePublicAboveAverage93130
83.29
Drexel UniversityPennsylvaniaColonial Athletic AssociationPrivateAboveAverage120134
80.99
University of South FloridaFloridaAmerican Athletic ConferencePublicAboveAverage94113
80.99
University of Nebraska-LincolnNebraskaBig Ten ConferencePublicAboveAverage11998
80.56
America East (Average)-America East-Conf-AboveAverage-202
80.55
Big Twelve Conference (Average)-Big Twelve Conference-Conf-AboveAverage-106
78.29
Arizona State University-TempeArizonaPacific 12 ConferencePublicAboveAverage10182
77.19
Big West Conference (Average)-Big West Conference-Conf-AboveAverage-202