University Benchmarks

Ranking the Top 100 Academic Universities

UniversityBenchmarks.com ranks the universities that attract and produce the best academic students.

There are many 'University Rankings' on the internet. Most rankings rely heavily on subjective metrics like 'reputation' and 'selectivity'. UniversityBenchmarks is purely an academic ranking model. The rankings are based on the reported academic and financial metrics of the colleges. There are no subjective factors like 'reputation' that are used. The calculations are performed using normal statistical models. All universities are considered equal and there is no weighting of the ranking categories.

The university 2014-2015 dataset is comprised of over 2400 US Universities & Colleges and comes from multiple sources using the most favorable reported metrics for a university.

The universities are ranked against each other in each filtered set. It is an iterative process whereby lower ranking universities are removed and the set is re-ranked until the final set of 100 is reached.

Selecting 'Rank Top 10 Only' will show the Top 10 for each filter category ranked against each other.

The academic rankings of the universities within the major conferences (ACC, Big12, Big10, Pac12, SEC) are available.

The 2017 rankings will be available in August.

Notes:
  • It is possible for universities to be ranked higher/lower than one another depending on the filter set.
  • Conference averages are based on the top 8 schools in the conference.
  • Public Schools are highlighted
  • Clicking on the university's seal icon will take you to the university's website.

Ranking Fields

Rank - Overall rank based on the average of the ranking fields (Scores, Difficulty, Smartest, Brainpower, Faculty and Research).

Scores - SAT & ACT scores. The university's test scores are corrected for dropout rate when score level is Good, Excellent or Elite. This will slightly boost scores for highly competitive schools.

Difficulty - Academic rigor is estimated based on how difficult it is to get an "A" at the university. An estimated GPA at the university is calculated for the average US Student. University grade inflation, average GPA, and STEM density are factors.

Smartest - University that can field the highest scoring students based on the average US University size. Higher Smartest Rank = "Smartest for the Average University"

Brainpower - The average "smartest" rank using 5 reference populations (CalTech, MIT, Stanford, GaTech and Berkeley). Higher Brainpower Rank = "Higher Density of Smart Students". The university ranked higher can mathematically field 'X' number of smarter students than universities ranked below them.

Faculty - Ranking based on number of % of faculty with awards and academy membership.

Research - Ranking is achieved by iteratively ranking the average of 3 research metrics (r-pop, r-stem, r-other ). The lowest ranked college is then removed and the new set is re-ranked. The result is the schools with potentially the strongest research environments per student bubble up to the top regardless of size or research budget.

  • r-pop - Average research spending for student population
  • r-stem - STEM research spending
  • r-other - Other/Medical/Health research spending

Salary ROI - "Salary Return on Investment" is not used in the overall ranking but is provided for additional information. Using the undergraduate average starting and mid-career salaries, the rank is based on a 20yr salary accumulation (with raises) minus the cost of a 4 year education at the university. Salaries are normalized across the country using the average COLA for the university's geo-economic region (7 regions total). The COLA effect is diminished by the level of the university. Elite, Excellent and Good universities have a greater distribution of graduates across the country and a diminishing COLA effect. The resultant value would be the graduate's spending potential over the 20yr period.

Overall ROI - "Overall Return on Investment" is not used in the overall ranking but is provided for additional information. The average of Overall Rank and Salary ROI. This would be the "Best academic bang for the buck". Colleges that produce the best education, at the best price, with the best return will be ranked higher.

Color Key - ranks are colorized as follows 1 2 3 4 5 6 7 8 9 10 50 100

The 2016 University Academic Rankings

Great Lakes Intercollegiate Ath Conf (Average)

2016 University Academic Rankings

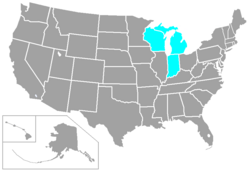
The GLIAC was founded in June 1972. Member institutions are located in the midwestern United States in the States of Michigan and Ohio, with affiliate members in Indiana and Illinois. Charter members include Ferris State, Grand Valley State, Lake Superior State, Northwood, and Saginaw Valley State. Former members include Oakland (1972-1997) and Westminster (1997-2000).

Sponsorship of football was dropped by the GLIAC after the 1989 season. Conference schools sponsoring football joined with football-playing members of the Heartland Football Conference to form the Midwest Intercollegiate Football Conference (MIFC), which began play in 1990. The MIFC merged with the GLIAC in July 1999 and the GLIAC resumed sponsorship of football that fall.

Tiffin University joined the GLIAC on July 1, 2008. Gannon University and Mercyhurst College left the GLIAC for the Pennsylvania State Athletic Conference on July 1, 2008.

Member schools | Current members | Pending members | Affiliate members | Former members | Former affiliate members | Membership timeline | Sports | Men's sponsored sports by school | Women's sponsored sports by school | Other sponsored sports by school | Football facilities | References

^ "Tiffin University Accepts Membership Invitation From the GLIAC" (PDF). Great Lakes Intercollegiate Athletic Conference. 2007. Archived from the original (PDF) on August 18, 2007. Retrieved 2007-05-27.

^ "PSAC Adds Gannon University and Mercyhurst College to Membership". Pennsylvania State Athletic Conference. 2007. Archived from the original on June 30, 2007. Retrieved 2007-05-27.

^ "Davenport, Purdue Calumet Accept Invites into GLIAC Membership Process". Great Lakes Intercollegiate Athletic Conference. Retrieved January 14, 2016.

External links

Text is available under the Creative Commons Attribution-ShareAlike License; additional terms may apply. By using this site, you agree to the Terms of Use and Privacy Policy. Wikipedia® is a registered trademark of the Wikimedia Foundation, Inc., a non-profit organization.

... [more on wikipedia]

This article uses material from the Wikipedia article "Great Lakes Intercollegiate Ath Conf (Average)", which is released under the Creative Commons Attribution-Share-Alike License 3.0

Great Lakes Intercollegiate Ath Conf Details

Great Lakes Intercollegiate Ath Conf Details
detail value
state-
conferenceGreat Lakes Intercollegiate At...
public-Conf-
scores1574/1049/24
levelAverage
rank[-
overall ROI rank[382
sizemedium-small
undergrads7221
grads2146
price37269
drop46
stem37
research40
scores validTrue
Common Questions...

What are the academic rankings for Great Lakes Intercollegiate Ath Conf (Average)?

1. number - for Academics.

2. number 382 for ROI (Return on Investment).

What universities are similar to Great Lakes Intercollegiate Ath Conf (Average)?

1. University of New Orleans

2. Louisiana Tech University

3. University of Idaho

4. University of Maine

5. University of Colorado Colorado Springs

6. University of Wyoming

7. Wichita State University


National Academic Rankings

(summary of all ranking placements)

Great Lakes Intercollegiate Ath Conf National Academic Rankings

Great Lakes Intercollegiate Ath Conf National Academic Rankings
category rank scores difficulty smartest brainpower faculty research salary ROI overall ROI
Conferences718555647340413958


Peer Universities / Similar Universities

(mathematically similar student body, size, academics, stem, salary... etc)

Great Lakes Intercollegiate Ath Conf Peer Universities, Similar Universities to Great Lakes Intercollegiate Ath Conf

Great Lakes Intercollegiate Ath Conf Peer Universities, Similar Universities to Great Lakes Intercollegiate Ath Conf
match image university state conference public level rank overall ROI
99.94
University of New OrleansLouisianaSouthland ConferencePublicAverage405309
98.38
Louisiana Tech UniversityLouisianaConference USAPublicAverage392213
91.85
University of IdahoIdahoSun Belt Conference / Big Sky ...PublicAverage379216
91.82
University of MaineMaineAtlantic 10 Conference / Ameri...PublicAverage248245
91.67
University of Colorado Colorado SpringsColoradoRocky Mountain Athletic ConferencePublicAverage451347
91.42
University of WyomingWyomingMountain West ConferencePublicAboveAverage250152
90.69
Wichita State UniversityKansasMissouri Valley ConferencePublicAverage382307
90.68
University of Southern MississippiMississippiConference USAPublicAverage493423
86.53
University of Michigan-FlintMichiganNo Conference AffiliationPublicAboveAverage189264
86.50
Rutgers University-NewarkNew JerseyNew Jersey Athletic ConferencePublicAverage371392
86.24
The Richard Stockton College of New JerseyNew JerseyNew Jersey Athletic ConferencePublicAverage350429
85.64
University of DaytonOhioPioneer Football League / Atla...PrivateAboveAverage278138
84.82
University of Minnesota-DuluthMinnesotaNorthern Sun Intercollegiate C...PublicAverage464346
84.67
Tennessee Technological UniversityTennesseeOhio Valley ConferencePublicAverage374212
84.22
Southern Illinois University-EdwardsvilleIllinoisOhio Valley ConferencePublicAverage438368
83.97
North Dakota State UniversityNorth DakotaMissouri Valley Conference / T...PublicAverage261196
83.58
Southern Illinois University-CarbondaleIllinoisMissouri Valley ConferencePublicAverage368278
82.99
University of ToledoOhioMid American ConferencePublicAverage405285
82.86
University of Nevada-RenoNevadaMountain West ConferencePublicAverage289340
82.80
University of Illinois at SpringfieldIllinoisGreat Lakes Valley ConferencePublicAverage403397
82.49
Boise State UniversityIdahoMountain West ConferencePublicAverage389329
81.98
The University of Texas at San AntonioTexasConference USAPublicAverage330180
81.89
Florida Atlantic UniversityFloridaConference USAPublicAverage305303
81.68
Texas Tech UniversityTexasBig Twelve ConferencePublicAverage176104
81.17
Florida International UniversityFloridaConference USAPublicAverage163170
79.06
Marquette UniversityWisconsinBig East ConferencePrivateAboveAverage197121
77.94
University of Missouri-Kansas CityMissouriWestern Athletic ConferencePublicAboveAverage197155
77.40
Cleveland State UniversityOhioHorizon LeaguePublicAverage440299
77.34
Rowan UniversityNew JerseyNew Jersey Athletic ConferencePublicAboveAverage306392
77.33
Wentworth Institute of TechnologyMassachusettsCommonwealth Coast ConferencePrivateAverage348352
77.10
New Mexico State UniversityNew MexicoSun Belt Conference / Western ...PublicBelowAverage486360
76.95
Montana State UniversityMontanaBig Sky ConferencePublicAboveAverage217168
76.85
University of the PacificCaliforniaWest Coast ConferencePrivateAboveAverage251344
76.74
CUNY Brooklyn CollegeNew YorkCity University of New York At...PublicAverage296394
76.74
University of North FloridaFloridaAtlantic Sun ConferencePublicAboveAverage219214
76.74
University of Hawaii at ManoaHawaiiMountain West Conference / Big...PublicAverage204245
76.54
Manhattan CollegeNew YorkMetro Atlantic Athletic ConferencePrivateAverage460378
76.45
Northern Illinois UniversityIllinoisMid American ConferencePublicAverage435289
76.35
University of LouisvilleKentuckyAtlantic Coast ConferencePublicAverage258224
76.33
California State University-ChicoCaliforniaCalifornia Collegiate Athletic...PublicAverage392409
75.88
University of Detroit MercyMichiganHorizon LeaguePrivateAboveAverage415313
75.78
University of Akron Main CampusOhioMid American ConferencePublicAverage331251
75.76
The University of Texas at El PasoTexasConference USAPublicBelowAverage499294
75.70
Kansas State UniversityKansasBig Twelve ConferencePublicAverage249168
75.67
Auburn UniversityAlabamaSoutheastern ConferencePublicAboveAverage13979
75.63
Oklahoma State UniversityOklahomaBig Twelve ConferencePublicAverage182124
75.54
University of New MexicoNew MexicoMountain West ConferencePublicAverage265153
75.50
University of North Carolina at CharlotteNorth CarolinaDivision I-AA Independents / C...PublicAverage292207
75.47
Indiana University-Purdue University-IndianapolisIndianaThe Summit LeaguePublicAverage427342
75.46
University of Wisconsin-MilwaukeeWisconsinHorizon LeaguePublicBelowAverage420367


Academic Peer Universities / Similar Academics

(mathematically similar academics)

Great Lakes Intercollegiate Ath Conf Academic Peer Universities, Similar Academic Universities to Great Lakes Intercollegiate Ath Conf

Great Lakes Intercollegiate Ath Conf Academic Peer Universities, Similar Academic Universities to Great Lakes Intercollegiate Ath Conf
match image university state conference public level rank overall ROI
97.40
The Summit League (Average)-The Summit League-Conf-Average-372
97.37
Nova Southeastern UniversityFloridaSunshine State ConferencePrivateAverage488397
96.79
Atlantic Sun Conference (Average)-Atlantic Sun Conference-Conf-Average-440
96.47
Mid - American Conference (Low)-Mid American Conference-Conf-Average-266
95.85
SUNY at Purchase CollegeNew YorkSkyline ConferencePublicAverage490470
95.36
University of Nebraska at OmahaNebraskaThe Summit LeaguePublicAverage491364
94.37
University of Louisiana at MonroeLouisianaSun Belt ConferencePublicAverage485352
94.11
Hampden-Sydney CollegeVirginiaOld Dominion Athletic ConferencePrivateAverage487498
92.99
John Brown UniversityArkansasSooner Athletic ConferencePrivateAboveAverage489421
91.66
Western Kentucky UniversityKentuckyConference USAPublicBelowAverage491433
91.42
New Jersey Athletic Conference (Low)-New Jersey Athletic Conference-Conf-Average-479
91.42
University of Southern MississippiMississippiConference USAPublicAverage493423
90.13
Southern California Intercoll Ath Conf (Low)-Southern California Intercoll ...-Conf-AboveAverage-427
88.95
Northeast 10 Conference (Average)-Northeast 10 Conference-Conf-AboveAverage-427
88.05
Northwest Conference (Average)-Northwest Conference-Conf-AboveAverage-440
87.26
Southern Collegiate Athletic Conference (Average)-Southern Collegiate Athletic C...-Conf-AboveAverage-426
85.77
New Mexico State UniversityNew MexicoSun Belt Conference / Western ...PublicBelowAverage486360
84.56
Southern Athletic Association (Average)-Southern Athletic Association-Conf-AboveAverage-408