University Benchmarks

Ranking the Top 100 Academic Universities

UniversityBenchmarks.com ranks the universities that attract and produce the best academic students.

There are many 'University Rankings' on the internet. Most rankings rely heavily on subjective metrics like 'reputation' and 'selectivity'. UniversityBenchmarks is purely an academic ranking model. The rankings are based on the reported academic and financial metrics of the colleges. There are no subjective factors like 'reputation' that are used. The calculations are performed using normal statistical models. All universities are considered equal and there is no weighting of the ranking categories.

The university 2014-2015 dataset is comprised of over 2400 US Universities & Colleges and comes from multiple sources using the most favorable reported metrics for a university.

The universities are ranked against each other in each filtered set. It is an iterative process whereby lower ranking universities are removed and the set is re-ranked until the final set of 100 is reached.

Selecting 'Rank Top 10 Only' will show the Top 10 for each filter category ranked against each other.

The academic rankings of the universities within the major conferences (ACC, Big12, Big10, Pac12, SEC) are available.

The 2017 rankings will be available in August.

Notes:
  • It is possible for universities to be ranked higher/lower than one another depending on the filter set.
  • Conference averages are based on the top 8 schools in the conference.
  • Public Schools are highlighted
  • Clicking on the university's seal icon will take you to the university's website.

Ranking Fields

Rank - Overall rank based on the average of the ranking fields (Scores, Difficulty, Smartest, Brainpower, Faculty and Research).

Scores - SAT & ACT scores. The university's test scores are corrected for dropout rate when score level is Good, Excellent or Elite. This will slightly boost scores for highly competitive schools.

Difficulty - Academic rigor is estimated based on how difficult it is to get an "A" at the university. An estimated GPA at the university is calculated for the average US Student. University grade inflation, average GPA, and STEM density are factors.

Smartest - University that can field the highest scoring students based on the average US University size. Higher Smartest Rank = "Smartest for the Average University"

Brainpower - The average "smartest" rank using 5 reference populations (CalTech, MIT, Stanford, GaTech and Berkeley). Higher Brainpower Rank = "Higher Density of Smart Students". The university ranked higher can mathematically field 'X' number of smarter students than universities ranked below them.

Faculty - Ranking based on number of % of faculty with awards and academy membership.

Research - Ranking is achieved by iteratively ranking the average of 3 research metrics (r-pop, r-stem, r-other ). The lowest ranked college is then removed and the new set is re-ranked. The result is the schools with potentially the strongest research environments per student bubble up to the top regardless of size or research budget.

  • r-pop - Average research spending for student population
  • r-stem - STEM research spending
  • r-other - Other/Medical/Health research spending

Salary ROI - "Salary Return on Investment" is not used in the overall ranking but is provided for additional information. Using the undergraduate average starting and mid-career salaries, the rank is based on a 20yr salary accumulation (with raises) minus the cost of a 4 year education at the university. Salaries are normalized across the country using the average COLA for the university's geo-economic region (7 regions total). The COLA effect is diminished by the level of the university. Elite, Excellent and Good universities have a greater distribution of graduates across the country and a diminishing COLA effect. The resultant value would be the graduate's spending potential over the 20yr period.

Overall ROI - "Overall Return on Investment" is not used in the overall ranking but is provided for additional information. The average of Overall Rank and Salary ROI. This would be the "Best academic bang for the buck". Colleges that produce the best education, at the best price, with the best return will be ranked higher.

Color Key - ranks are colorized as follows 1 2 3 4 5 6 7 8 9 10 50 100

The 2016 University Academic Rankings

Centennial Conference (Low)

2016 University Academic Rankings

This article includes a list of references, related reading or external links, but its sources remain unclear because it lacks inline citations. Please improve this article by introducing more precise citations. (March 2013) (Learn how and when to remove this template message)

Eleven highly selective private colleges compose the Centennial Conference. The institutions are renowned nationally for their traditions in higher education excellence, each with impressive academic histories. Ten of the eleven members of the Centennial Conference rank among the top 100 national liberal arts colleges (with Johns Hopkins University being the only research intensive university in the conference), and six of the members are within the top 50.

On the average, Centennial members boast of 19 varsity teams per campus which is well above the national norm. Conference members have won eleven NCAA team titles: Johns Hopkins women's cross country (2012, 2013, 2014), Gettysburg women's lacrosse (2011), Haverford men's cross country (2010), Franklin & Marshall women's lacrosse (2007, 2009), Ursinus field hockey (2006), Washington men's lacrosse (1998), and Washington men's tennis (1994, 1997).

History

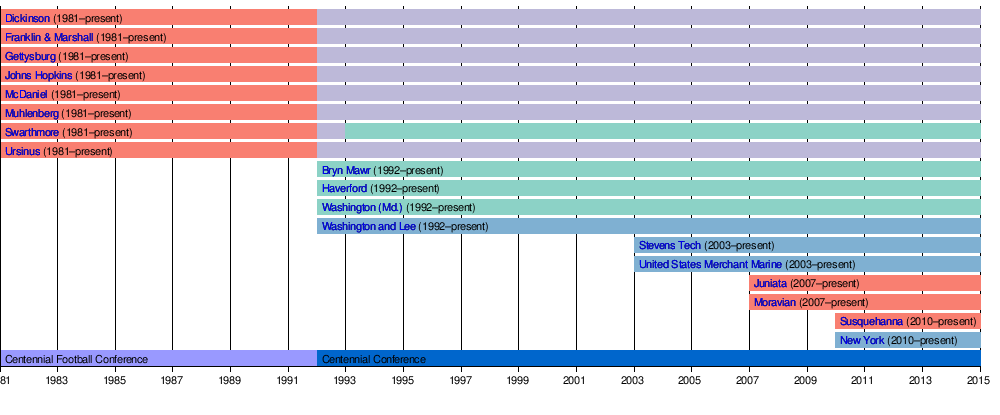
According to the Centennial Conference's web site: "On June 4, 1981, Keith Spalding, then-president of Franklin & Marshall College, made the announcement that "eight private colleges found it timely and appropriate to form a round-robin football schedule among institutions with similar attitudes and practices in intercollegiate football competition." With that statement, the Centennial Conference was born. Those private colleges were Dickinson College, Franklin & Marshall College, Gettysburg College, Johns Hopkins University, Muhlenberg College, Swarthmore College, Ursinus College, and Western Maryland College (later renamed and now known as McDaniel College).

The conference moved from a football-only conference to an all-sports conference after a 1991 feasibility study. The study also recommended to expand from eight schools to eleven. The other schools recommended were Bryn Mawr College, Haverford College, and Washington College. Those three schools accepted and became charter members in 1992 as the conference expanded its sports offerings.

All of the charter members defected from the Middle Atlantic Conference, MAC. Johns Hopkins and McDaniel College both played in the Mason-Dixon Conference prior to entering the MAC in 1975.

Member schools | Current members

- Johns Hopkins was on multiple all-sports conference affiliation membership for some sports in the University Athletic Association until the end of the 2000-01 season.

Affiliate members | Membership timeline | Sports

Teams compete in men's and women's cross country, field hockey, football, men's and women's soccer, women's volleyball, men's and women's basketball, men's and women's swimming, men's and women's track and field, wrestling, baseball, men's and women's golf, men's and women's lacrosse, softball and men's and women's tennis.

References | External links

Text is available under the Creative Commons Attribution-ShareAlike License; additional terms may apply. By using this site, you agree to the Terms of Use and Privacy Policy. Wikipedia® is a registered trademark of the Wikimedia Foundation, Inc., a non-profit organization.

... [more on wikipedia]

This article uses material from the Wikipedia article "Centennial Conference (Low)", which is released under the Creative Commons Attribution-Share-Alike License 3.0

Centennial Conference Details

Centennial Conference Details
detail value
state-
conferenceCentennial Conference
public-Conf-
scores1755/1170/26
levelAboveAverage
rank[-
overall ROI rank[415
sizesmall
undergrads2416
grads1927
price61579
drop12
stem22
research261
scores validTrue
Common Questions...

What are the academic rankings for Centennial Conference (Low)?

1. number - for Academics.

2. number 415 for ROI (Return on Investment).

What universities are similar to Centennial Conference (Low)?

1. California Lutheran University

2. Concordia College at Moorhead

3. Gustavus Adolphus College

4. Grove City College

5. Rockhurst University

6. Arcadia University

7. DePauw University


National Academic Rankings

(summary of all ranking placements)

Centennial Conference National Academic Rankings

Centennial Conference National Academic Rankings
category rank scores difficulty smartest brainpower faculty research salary ROI overall ROI
Conferences56329883725879376


Peer Universities / Similar Universities

(mathematically similar student body, size, academics, stem, salary... etc)

Centennial Conference Peer Universities, Similar Universities to Centennial Conference

Centennial Conference Peer Universities, Similar Universities to Centennial Conference
match image university state conference public level rank overall ROI
92.40
California Lutheran UniversityCaliforniaSouthern California Intercoll ...PrivateAboveAverage481488
86.57
Concordia College at MoorheadMinnesotaMinnesota Intercollegiate Ath ConfPrivateAboveAverage430444
86.56
Gustavus Adolphus CollegeMinnesotaMinnesota Intercollegiate Ath ConfPrivateAboveAverage239210
86.42
Grove City CollegePennsylvaniaPresidents' Athletic ConferencePrivateAboveAverage235202
86.28
Rockhurst UniversityMissouriGreat Lakes Valley ConferencePrivateAboveAverage404250
86.21
Arcadia UniversityPennsylvaniaMiddle Atlantic States Athleti...PrivateAverage467478
86.11
DePauw UniversityIndianaNorth Coast Athletic ConferencePrivateAboveAverage304173
85.98
Willamette UniversityOregonNorthwest ConferencePrivateAboveAverage300402
85.86
Saint Michael's CollegeVermontNortheast 10 ConferencePrivateAboveAverage329452
85.78
Messiah CollegePennsylvaniaMiddle Atlantic States Athleti...PrivateAboveAverage387436
85.75
Berry CollegeGeorgiaSouthern Athletic AssociationPrivateAboveAverage390412
85.75
Eckerd CollegeFloridaSunshine State ConferencePrivateAboveAverage495417
85.62
Canisius CollegeNew YorkMetro Atlantic Athletic ConferencePrivateAverage467484
85.58
Allegheny CollegePennsylvaniaNorth Coast Athletic ConferencePrivateAboveAverage322411
85.38
Wittenberg UniversityOhioNorth Coast Athletic ConferencePrivateAboveAverage441295
85.24
University of Minnesota-MorrisMinnesotaUpper Midwest Athletic ConferencePublicAboveAverage321161
85.14
Siena CollegeNew YorkMetro Atlantic Athletic ConferencePrivateAboveAverage462479
85.03
Wagner CollegeNew YorkNortheast ConferencePrivateAboveAverage385412
84.93
Seattle Pacific UniversityWashingtonGreat Northwest Athletic ConferencePrivateAboveAverage383384
84.88
Cedarville UniversityOhioPrivateAboveAverage287278
84.69
Virginia Military InstituteVirginiaBig South ConferencePublicAboveAverage444227
84.66
Hope CollegeMichiganMichigan Intercollegiate Athle...PrivateAboveAverage244227
84.66
Webster UniversityMissouriSt.Louis Intercollegiate Ath ConfPrivateAboveAverage458421
84.64
Ursinus CollegePennsylvaniaCentennial ConferencePrivateAboveAverage327378
84.58
Wofford CollegeSouth CarolinaSouthern ConferencePrivateAboveAverage340211
84.49
University of the SciencesPennsylvaniaCentral Atlantic Collegiate ConfPrivateAboveAverage338272
84.48
Simmons CollegeMassachusettsGreat Northeast Athletic ConferencePrivateAboveAverage376452
84.47
Berea CollegeKentuckyIndependent Southeast RegionPrivateAboveAverage497494
83.63
Seattle UniversityWashingtonWestern Athletic ConferencePrivateAboveAverage280320
83.33
Gonzaga UniversityWashingtonWest Coast ConferencePrivateAboveAverage235214
83.18
Adelphi UniversityNew YorkNortheast 10 ConferencePrivateAboveAverage365444
81.89
University of DaytonOhioPioneer Football League / Atla...PrivateAboveAverage278138
81.59
University of Northern IowaIowaMissouri Valley ConferencePublicAboveAverage252248
81.47
University of VermontVermontAmerica EastPublicAboveAverage136191
81.34
Rowan UniversityNew JerseyNew Jersey Athletic ConferencePublicAboveAverage306392
81.24
University of North Carolina WilmingtonNorth CarolinaColonial Athletic AssociationPublicAboveAverage221228
80.99
University of California-Santa CruzCaliforniaDivision III IndependentsPublicAverage157208
79.64
University of Puget SoundWashingtonNorthwest ConferencePrivateGood227223
79.62
Denison UniversityOhioNorth Coast Athletic ConferencePrivateGood204170
79.52
Trinity UniversityTexasSouthern Collegiate Athletic C...PrivateGood212170
79.48
Augsburg CollegeMinnesotaMinnesota Intercollegiate Ath ConfPrivateAverage437376
79.26
Union UniversityTennesseeGulf South ConferencePrivateGood225213
79.12
North Central CollegeIllinoisCollege Conference of Illinois...PrivateAverage455382
79.07
Furman UniversitySouth CarolinaSouthern ConferencePrivateGood232192
79.06
Yeshiva UniversityNew YorkSkyline ConferencePrivateGood141208
79.05
Maryville University of Saint LouisMissouriGreat Lakes Valley ConferencePrivateAverage424426
78.99
The College of WoosterOhioNorth Coast Athletic ConferencePrivateGood277317
78.99
Le Moyne CollegeNew YorkNortheast 10 ConferencePrivateAverage500485
78.84
Pacific Lutheran UniversityWashingtonNorthwest ConferencePrivateAverage439431
78.63
Alfred UniversityNew YorkEmpire EightPrivateAverage471475


Academic Peer Universities / Similar Academics

(mathematically similar academics)

Centennial Conference Academic Peer Universities, Similar Academic Universities to Centennial Conference

Centennial Conference Academic Peer Universities, Similar Academic Universities to Centennial Conference
match image university state conference public level rank overall ROI
98.00
Saint Michael's CollegeVermontNortheast 10 ConferencePrivateAboveAverage329452
96.97
Kettering UniversityMichiganNo Conference AffiliationPrivateAboveAverage332139
96.07
Ohio Northern UniversityOhioOhio Athletic ConferencePrivateAboveAverage332170
96.00
Ursinus CollegePennsylvaniaCentennial ConferencePrivateAboveAverage327378
95.85
LeTourneau UniversityTexasAmerican Southwest ConferencePrivateAboveAverage328173
95.43
Maryland Institute College of ArtMarylandNo Conference AffiliationPrivateAboveAverage335440
95.16
Minnesota Intercollegiate Ath Conf (Average)-Minnesota Intercollegiate Ath Conf-Conf-AboveAverage-242
94.75
Southern Athletic Association (Average)-Southern Athletic Association-Conf-AboveAverage-408
93.46
Georgia College and State UniversityGeorgiaPeach Belt ConferencePublicAboveAverage334352
92.91
Atlantic 10 Conference (Low)-Atlantic 10 Conference-Conf-AboveAverage-336
92.42
Empire Eight (Average)-Empire Eight-Conf-AboveAverage-460
89.65
America East (Low)-America East-Conf-Average-364
88.92
University of Akron Main CampusOhioMid American ConferencePublicAverage331251
88.20
Great Lakes Valley Conference (Low)-Great Lakes Valley Conference-Conf-Average-319
85.04
The University of Texas at San AntonioTexasConference USAPublicAverage330180
85.04
Conference USA (Low)-Conference USA-Conf-Average-272
84.86
Big Sky Conference (Low)-Big Sky Conference-Conf-Average-245
82.16
Big West Conference (Low)-Big West Conference-Conf-Average-385